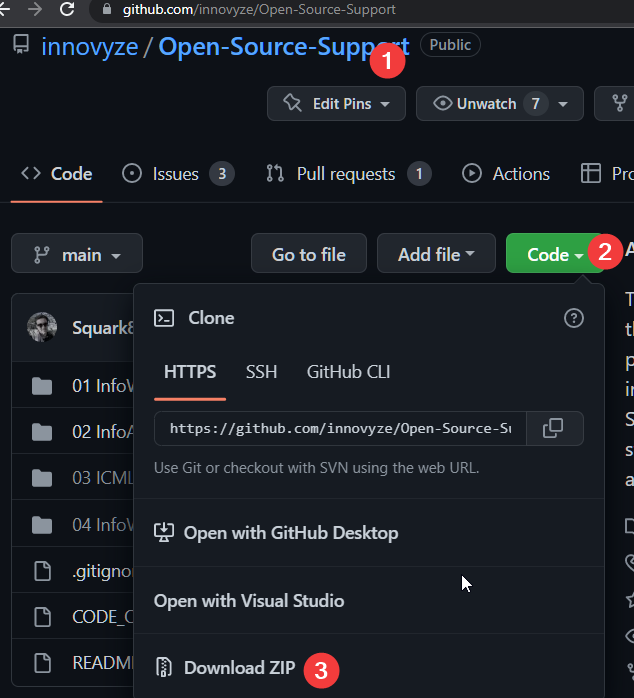
source: github
Introduction
Spatially varying rainfall in InfoWorks ICM help to improve the rainfall spatial accuracy. You can add spatially varying rainfall into InfoWorks ICM using a Rainfall Event or Spatial Time Series Database.
A rainfall event object records rainfall for a network of rain gauges. Each gauge has a time series, a boundary and/or point for its location.
Spatial time series database is for radar or spatial forecast rainfall which have a large number of cells. The data is provided as an animation, each frame is for a time step, and each pixel in the frame is the rainfall value for the cell at that time step.
The online help explains how rainfall changes over large areas,
“Small rain cells typically produce short-duration storms. Small rain cells have a short life, or move rapidly across the catchment. As these cells are of the order of a kilometre across, there is a significant spatial variation in rainfall intensity.
Large rainfall cells tend to produce longer duration storms. Large weather systems tend to produce large rainfall cells. There is therefore less spatial variation of intensity.”
Traditionally, rainfall are only measured at a handful of locations for very large areas, InfoWorks ICM improves the rainfall accuracy with the following assumptions,
- If the rain gauge has no location or boundary, be default, InfoWorks ICM applies rainfall smoothing to smooth the rain gauge data based on the subcatchment area, the larger the area, the smoother the resulting rainfall for the subcatchment.

- If the rain gauges have Gauge Boundaries, the centroid of the subcatchment will be used to determine which rain gauge to use, refer to Using Spatial Rainfall in Simulations for more details.
Refer to Gauge Boundaries for more information setting up rainfall with spatial data in InfoWorks ICM.
In this article, you will build a rainfall event with a regular radar rainfall type of grid, and then add labels for each grid.
Gridded rainfall
Although rainfall event is designed mainly for recording rain gauge network data, it can be used for radar rainfall, too. Radar rainfall has a regular grid instead of rain gauge boundaries formed around each rain gauge. The data is usually organized as a polygon layer showing the grids, and a table showing the rainfall for each grid cell.

Importing the rainfall time series
- Import the time series data in data/input/rainfall.csv into a rainfall event object

- InfoWorks ICM automatically recognizes the format, make sure the unit is correct.

- A rainfall event object will be created.
Import the grid polygons
- Add the cell polygon layer to GeoPlan, data/input/cell.shp

- Import the grid into the rainfall event from map data

- Save the boundaries to the rainfall event object


- Open the rainfall event and review the data.


- The boundary information is saved as “Gauge data” attribute, REGION=COUNT, X1, Y1, X2, Y2
- COUNT is the number of vertices in the polygon
- The following x, y pairs define the polygon

- For most applications, this is all you need to setup the gridded rainfall. However, if you would like to label each cell with the profile number, follow the instructions below.
Adding label to gridded rainfall cells
InfoWorks ICM labels each rain gauge boundary using the “LOCATION=X, Y” tag in the “Gauge data” attribute. However, this information is not automatically generated when importing the boundaries from a polygon layer, and it needs to be manually added.
- Export the rainfall event object as an InfoWorks CSV file,

- Open your Python editor and paste the following code into it, a copy of the code can be found at ‘add_location.py’.
import csv
def parse_line(line):
    """
    below is an example of a line of gage data,
    "REGION=5,622593.573099,162478.222631,621601.116681,162654.635489,621780.655846,163630.062159,622773.118767,163453.650017,622593.573099,162478.222631;LOCATION=2323,233423;"
    find all the x, y pairs of the region, then calculate the center of the region and add ;LOCATION=X, Y; to the end of the line
    Args:
        line (str): REGION=XXXX
Returns:
str: the line with location=x,y added.
"""
line = line.replace('"', '')
xy = [float(x) for x in line.split(';')[0].replace('REGION=', '').split(',')]
ct = int(xy[0])
xy = xy[1:]
# print(ct)
# print(xy)
xs =[xy[2*i] for i in range(ct)]
ys =[xy[2*i + 1] for i in range(ct)]
x = sum(xs)/ct
y = sum(ys)/ct
return "{}LOCATION={},{};".format(line, x, y)def add_location(input_csv, updated_csv):
"""add location=x, y to each profile and save the csv file Args:
input_csv (str): ICM rainfall csv file, with region for each profile without location information
updated_csv (str): ICM rainfall csv file with center of region added
"""
with open(updated_csv, 'w') as f:
with open(input_csv) as o:
for line in o:
if "REGION=" in line:
for l in csv.reader([line]):
c2 = parse_line(l[2])
line = '{},{},"{}"\n'.format(l[0], l[1], c2)
f.write(line)
# csv exported from InfoWorks ICM without labels
input_csv = './data/gridded_no_location.csv'
# import this csv file below back to InfoWorks ICM which will show labels
updated_csv = './data/gridded_with_location.csv'
add_location(input_csv, updated_csv)
- Update the last few lines of code,
- Input_csv: the rainfall event file exported from InfoWorks ICM without rain gauge labels.
- Updated_csv; the rainfall event file to be imported into InfoWorks ICM with rain gauge labels.
- Run the script to generate the updated csv file
- Import the updated rainfall csv file into InfoWorks ICM

- Drag the new rainfall object into your network, and the labels will show.

Conclusion
By utilizing Rainfall Events and Spatial Time Series Databases, InfoWorks ICM supports both rain gauge and radar-based grid data, enabling precise modeling of rainfall patterns. The process involves importing time series data and grid polygons, with the option to label grid cells with python script.